Test
As a geoscientist analyzing facies distribution, I want to filter pie chart labels based on a discrete property (e.g., proportion cutoff) and manually adjust label positions so that I can avoid overlapping text and improve the readability of facies visualization.
Well intervals – Pie Chart labels overlap
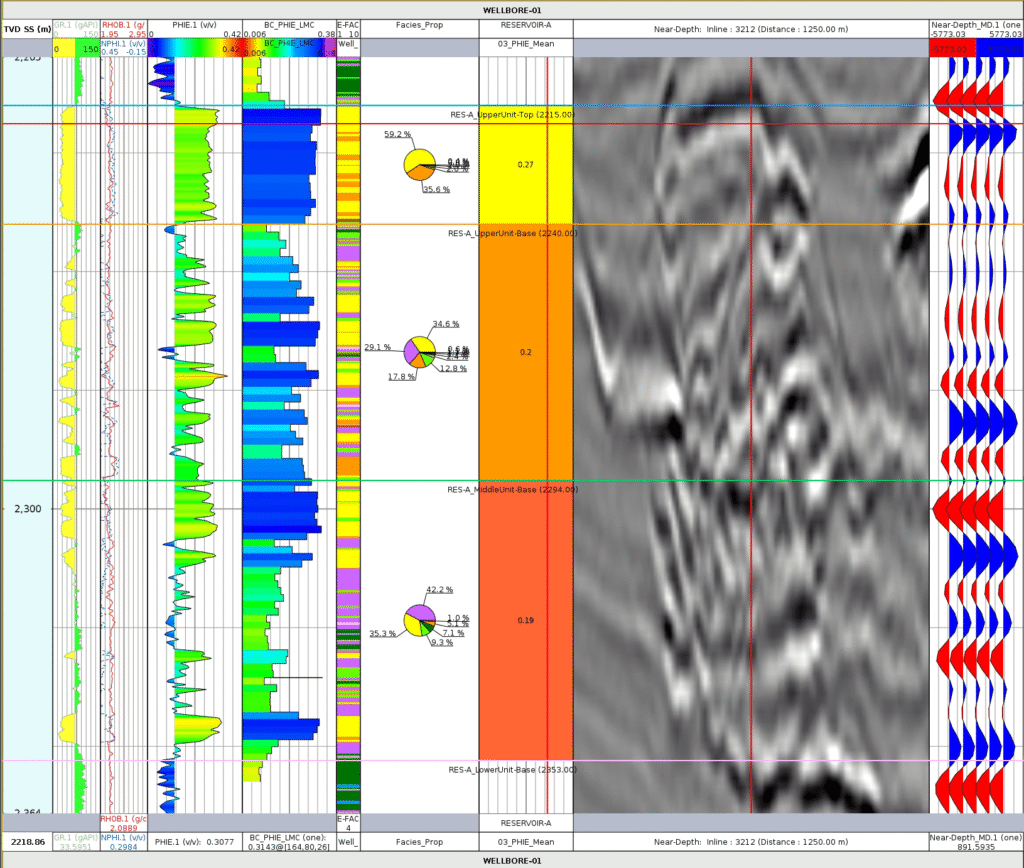
Problem: superposition of facies with low proportion. – Solution 1: add a filter to remove text based on proportion value (discrete property) -> a cutoff, e.g. 2% – Solution 2: add possibility to move the labels manually